Thursday, December 14, 2017

Understanding Sugar Sector Part 2: "When Growth Kills"

In our previous post on the Indian sugar sector, we discussed how incumbents have found it extremely difficult to operate in a myriad of regulations that govern the operating cycle of the industry.

In this post we have tried to present a picture of how the companies in the sector stack up against each other by comparing them across some parameters that we find useful in comparing companies in the sugar sector and have highlighted our findings below:
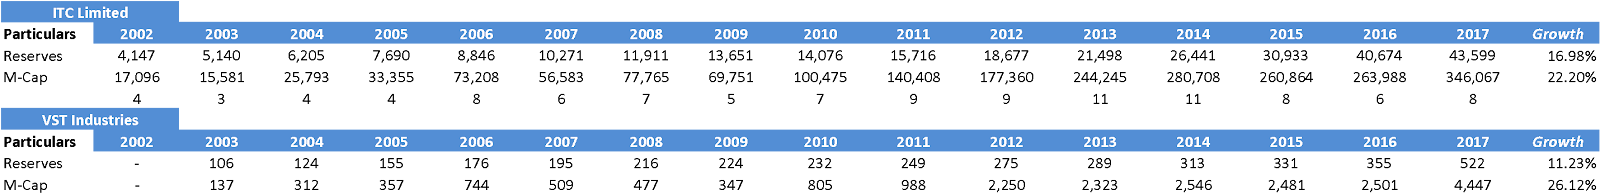


Commodity businesses derive their moats from being cost leaders and generally industry leaders tend to be the most efficient companies in the business as economies of scale works to their advantage. The cost intensity of manufacturing sugar means that companies must optimize cane procurement and conversion processes so as to increase the recovery rate.

However, as we can see in the sugar sector the leader seems to be reeling under extreme stress. We already know that a leveraged balance sheet in a cyclical sector lends itself to a plethora of pain when the force of gravity imposes itself on the business. The manufacturing of sugar is both fixed and working capital intensive and only a select few are able to withstand the wild cyclical swings. Shishir Bajaj led Bajaj Hindustan is the industry leader with a crushing capacity of 136,000TCD and has been the torch bearer of the stress faced by companies across cycles
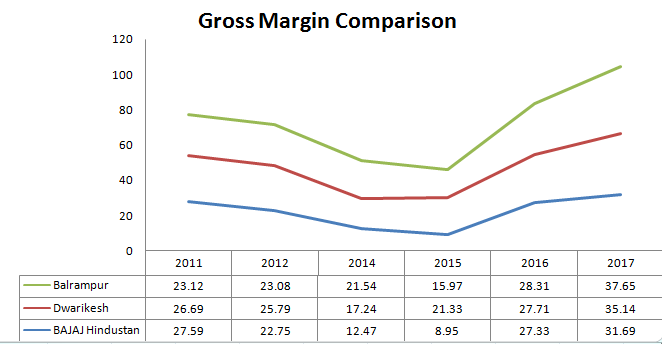
We have compared Bajaj Hindustan to Balrampur Chini and Dwarikesh Sugar on select parameters to understand why the sector leader has performed in this fashion and how other companies have taken advantage of this and have highlighted our findings below -

  • We first compared the gross margins of these companies to understand profitability that accrues to the sector. Incremental gross margins for an integrated sugar company are primarily driven by the sale of associated by-products as the marginal revenue accruing from these is significantly higher than the marginal cost incurred in the conversion process


The observations from the above data are quite intriguing especially in light of the fact that Bajaj Hindustan actually has the lowest contribution from sugar to its overall revenues

Sugar contribution to overall revenues for the three companies


  • The most common yardstick of a mill's efficiency is the recovery rate of sugar. Within Uttar Pradesh, mills located in the eastern region of Bijnor have the highest recovery rates, due to usage of high-yielding early sugarcane varieties like CO 0238. These early varieties of sugarcane fetch the farmer Rs 10 more per quintal than the general variants.
    Bajaj Hindustan's mills are predominantly situated in and around the district of Lakhimpur Kheri which is towards the southern part of the state. We took the recovery rates for both DCM Shriram (a listed peer with a presence in the same region) and Bajaj to check how recovery rates differ for both companies


The difference in recovery rates is quite stark and as both companies have mills around similar geographies. To understand why Bajaj Hindustan has sub-optimal gross margins and recovery rates, we compare and analyze the cash conversion cycle for BHSL vis a vis its peers


The payable days for Bajaj Hindustan are nearly four times its peers - thereby leading to higher COGS as the company is obliged to compensate in the form of interest payments on its dues to farmers. Sugar companies have to keep a high inventory component as crushing is a seasonal activity but demand for sugar is secular, and while the other companies finance this through working capital loans, BHSL does it through delaying cane payments as the balance sheet does not have scope for further leverage

Keeping the cane farmer happy is central to the sustainability of this business - and any delay in payments has a prolonged impact on the goodwill of a sugar mill. Add to that, the penal consequences imposed on delayed disbursements are severe as the state government has imposed strict norms to ensure timely payments.

Source: Financial Express, 13th April 2017                                    

The natural chain of events would suggest to us that Bajaj Hindustan would invariably face the wrath of the farming community in the form of both low quality as well as quantity of supplies. We took the crushing capacity / day for Dhampur Sugar and Dwarikesh Sugar (both of whom have a presence in the area of Bijnor) in our effort to understand the root causes of in-efficiency for BHSL

(Bajaj Hindustan and Dwarikesh both changed their accounting months in 2014 and 2015 respectively)


Despite having the largest capacity, Bajaj Hindustan operates its mills for the least number of days in comparison to peers. The underlying scale of business hence loses out to operational in-efficiency, thereby creating a lollapalooza of ever surmounting debt and farmer agitation thus leaving the company in a situation of mess which is difficult to come out from.

We will continue this post with further work on companies highlighting how they have positioned themselves differently so that  once this honeymoon period for sugar sector gets over how can they emerge better positioned to weather the downturn in cycle that awaits them in future.


Monday, December 4, 2017

Capital Allocation - A tale of two companies: Reliance AMC & Motilal Oswal Financial Services

Investors have always been attracted to companies which are cash generating machines. The reason is simple. The cash generators survive market cycles. They keep doling out huge cash in turn which is either re invested if the business is in growth phase or returned as dividends if the company is in mature phase and doesn’t needs cash for reinvestment. In both the cases its beneficial for the minority shareholders because internal accruals is the cheapest source of capital for a company to build a business while if free cash is given off as dividends or buybacks it puts money in hand of shareholders directly.
While the free cash generation capacity makes these business attractive there is an inherent risk which lurks which some investors fail to identify. Capital Allocation becomes very important for a company which is generating huge amounts of cash from its operations. The simple thing to do would be to keep re investing in the business but not all businesses are at similar stages of growth. Thus some companies choose to give off the money as dividends to shareholders. However, in a case where a company does not share cash with shareholders but re invests in its business it needs to be identified whether the business is/will be able to generate returns higher than opportunity cost of capital for shareholders. Many times companies have squandered cash from good business in bad business while showing it off as diversification. However it becomes difficult for an investor to differentiate between diversification and wasteful conglomerisation. The loser is the minority shareholder.
We can see the difference that capital allocation makes on returns for a shareholder
  • ITC has grown market cap at a rate of 22 percent over a growth in reserves of 19% while VST Industries has grown market cap. at a rate of 26 percent with a much lower growth in reserves at 11 percent
  • While ITC ploughs money from highly profitable ciggarate business into loss making hotels, early stage FMCG, agri operations etc VST follows a simple approach of paying off cash as dividends
  • The difference in returns for a shareholder in VST and ITC are there to see
To put in simple words an investment of Rs 1 lakh made in ITC 14 years ago would have resulted in Rs 16.55 lakhs while a similar amount invested in VST Industries would have resulted in Rs 25.5 lakhs. That is a difference of over 50 percent on the final amount. This is why capital allocation is important for companies and also for investors

Over the last few months a new space that has seen much action in the recent times, one due to inflow of money by domestic investors which has made the “assets under management” (AUM) touch new highs everyday while next due to the listing of one of the biggest companies in the asset management space – Reliance Nippon Asset Management Co. (RNAM) is the “Asset Management” industry.
 
The point that catches our eye in this industry is the ability to generate large amounts of cash flow and minimal use of capital to grow this business. This is a combination which will allow companies in this space (especially leaders) to generate large amounts of cash. We find this business to be very interesting because capital allocation will become very important when you have large amounts of idle cash. It is a great way to test management honesty and acumen.
We have already seen how capital allocation of management decides what will future returns are from a cash generator. Thus now let us have a look at how two companies in the AMC sector operate and let’s understand how they are allocating capital for themselves and their shareholders  
Motilal Oswal is a diversified financial conglomerate with varied interests in the areas of broking, asset management and housing finance. On the other hand, Reliance Nippon is a pure play Asset Management Company with a host of offerings that include mutual funds(both debt and equity) , Alternative Investment funds and Portfolio Management services for both individuals and institutions
First we would like to give some facts about the AMC industry in India
  • There are 41 AMC’s in the country, of which 9 are owned by government, 7 by foreign and 25 domestic private institutions
  •  Five of the top AMC’s control 57 percentage of the market with 36 accounting for the rest
Now we start our exercise in understanding the fund structure and capital allocation policies which both Reliance AMC & Motilal Oswal following terms of deploying the windfall that they get in terms of free cash.

 
Reliance AMC
To understand the implication of capital allocation policies, let us first look at the difference between core business pre-tax RoE's. The pre tax RoE in this case is equal to the PBT + unrealized income on investments divided by average equity
The profit before tax includes the component of other income which should be subtracted to understand core business RoE's. Similarly, the denominator should be reduced by the amount of interest/income earning assets that the company has invested into. The excel attached below shows the calculation for the same
Thus core ROE’s of AMC business which Reliance operates is on an average over 100% every year which portrays the operational strength of the industry in which it operates. The benefit of operating leverage once leadership position is established is enormous for the industry
Now to answer the question that why reported RoE's are so depressed in relation to core business RoE's?
We listed down all the investments that the company had made from its internal accruals and calculated the subsequent returns earned. To not obscure our findings, we included both realized and unrealized gains that have accrued to the company
Observation
  1. The company practices a diversified approach to asset allocation
  2. The part that is worrying are the inter corporate deposits, more so because we know who the related party for Reliance AMC are
  3. Even though the fund house has a sizeable private equity corpus, the balance sheet doesn't seem to have any investments into them as of March 2017
  4. The returns for a shareholder of RAMC would depend upon asset allocation policies of the management

Motilal Oswal Financial Services (MOFS)
It would be imperative for the reader to understand that MOFS is a diversified financial services business with interests in the credit business as well. So in this regard, an apple to apple comparison is not possible. What needs to be done is that the consolidated balance sheet of the company must be looked at ex of the loans and advances made as they pertain to the housing finance business if one needs to compare yields that both companies are earning on their investments
We took the data of the last three years for Motilal AMC (as the mutual fund schemes were launched only in the year 2014) and tried understanding profitability trend through ROE since inception of the schemes (prior to the Mutual fund triumvirate, MO-AMC was a pure play portfolio management services firm with an AuM growth of 10.65 percent in 7 years)
Let us now look at the capital allocation policies of MOFS
Observation
  1. The company practices an approach which is highly tilted towards equities and real estate
  2. Amongst equities MOFS also runs a private equity business which allows an investor to take exposure in the highly lucrative private equity and venture capital space
  3. MOFS also runs a Real Estate fund which gives exposure to real estate opportunities arising in the country
Reliance AMC vs MOFS
  1. While MOFS is a firm specialized in one domain – equities Reliance MAC manages a diversified pool which includes debt assets as well where the yields are very low thus depressing yields
  2. While the clients of MOFS includes HNI’s interested in PMS and equity schemes Reliance AMC manages the corpus for EPFO & NPS pension scheme which carries virtually zero yields
Thus the capital allocation of MOFS is tilted towards only one domain ie. Equity while Reliance has diversified it across multiple asset classes and also there seems to be some unanswered inter corporate loans which warrants further attention.