Sometimes
there exists a situation which becomes difficult for the human mind to
comprehend. The sugar sector in India is one such where it is difficult
to understand why such a dire situation exists for a sector which forms a
backbone for the agrarian economy in the country.
This has been proven time and again that for anything to flourish the entire ecosystem has to benefit.
We cannot expect to compensate one part of the value chain by squeezing
the neck of the other. However this is what existed in the sugar sector
as early as 2015. Have a look at what the biggest sugar miller in India
had to say in 2015….
This
is an extract from the annual report of Balrampur Chini in 2015. We
cannot expect to hold one part of the value chain at ransom to over
compensate the requirements of another. This is simply not sustainable,
especially in a sector which is so important to the ecosystem of the
country. Let’s have a look at some simple facts of the sugar economy in
India
Facts about the Indian Sugar Industry
Aggregate demand of 25MT with a population of 1.32 billion as on 2016
Per capita consumption of around 20kg per year
India is the world’s largest consumer and second largest producer in the world
However in 2017 the company had a different tone
The profits have shot up
This
is an exercise in finding out what changed and foremost what ails this
sector so deeply that it forms a part of the untouchables for many. To
understand that we tried to dig deep into the workings of the sugar
sector and this is Part 1 of our exercise which will be followed by much
deeper understandings of how this industry works and is anything
changing?
Let’s first understand how sugar is made…
The
process of making sugar starts at the farmland with the sowing of the
sugarcane crop. Sugarcane is a water-intensive crop (1 kg of sugar
production in Maharashtra requires around 2300 liters of water) and any
shortage of the same significantly inhibits growth.
In India, there are three variants of the same namely –
The spring crop sown in March,
The Adsali Crop sown in July and
The Autumn Crop sown in September
The adsali and the spring
Crop take 18 months to mature while the autumn crop takes 12 months to
mature before they can be cut and sent to sugar mills for further
processing.
The
cultivation of sugarcane happens through the age old ‘ratooning’ method
in which subterranean buds on stubble (the part of cane left
underground after harvesting plant cane), gives rise to succeeding crop
stand which is usually referred to as ‘ratoon’ or the ‘stubble crop’
Now that we know how sugarcane is cultivated & harvested let’s understand what happens next…
Once the cane is harvested, it is then taken to the sugar factory for conversion. The sugar mill needs to be in very close proximity to the sugarcane farms.
Let’s understand why…..
A longer distance between farm and mill would increase the cost of production
The sucrose content in cane rapidly declines after harvesting hence time between harvesting and conversion needs to be minimized
The conversion process
Let us first present a flow chart that depicts how sugarcane is converted among the many products
(Source: Dwarikesh Sugar)
A sugar mill can be a standalone facility where the output is only sugar or an integrated facility producing other by products as well
By products of crushing sugarcane are sugar, molasses & bagasse
While molasses are used to produce ethanol & alcohol, bagasse is used to generate power
Let’s understand how an integrated facility helps…
Bagasse used to generate power is used for own production as well as sold in open market
Ethanol is mandated to be used as an additive in fuel
Molasses are sold to the alcohol industry
All of this helps in managing realizations as sugar production is weighed down by high fixed costs, volatile realizations & vagaries of government policies. Let us try an understand each of these point in details
High Fixed Costs
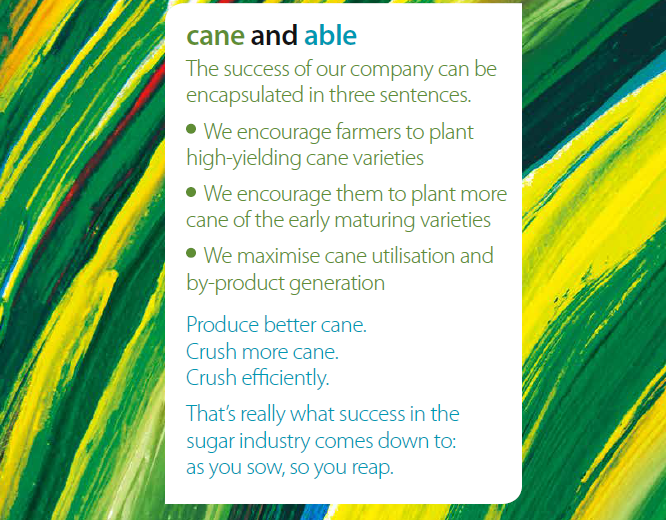
For
any commoditized business, having low cost production and optimizing
usage of by-products are imperative for sustaining profitability. In
this case, optimizing output from each ton of cane
procured is an absolute necessity for an integrated mill to ensure
maximum production of both sugar and its associated by-products.
This variable is measured by tracking the recovery rate. The
recovery rate is the quantity of sugar that is retrieved from
processing one tone of sugarcane. Let us explain how this works. For eg:
If the recovery rate is 11.5% that means for every tone of cane
processed you get 115 kilograms of sugarcane.
The recovery rate is not standard across regions. It depends on soil, climatic conditions, variety of crop used, etc.
Let us now show you how the recovery rate affects all the byproducts of sugarcane conversion assuming 1 tonne of sugarcane
Vagaries of Government Policies
To understand how the government policies affect the sugar sector first let us understand why the sugar sector is so important for the government:
With 5 million hectares of land under cultivation the industry supports over 50 million farmers
The three big states of Uttar Pradesh, Maharashtra & Karnataka produce over 75% of the production
While
Uttar Pradesh is dominated by private companies, Maharashtra is
dominated by co operative mills belonging to state government
The production capacity in the country is roughly distributed equally among private and co operative entities
Thus the Central Government sets
the Fair Remunerative Price (FRP) each year, which is the minimum price
the sugar mill has to pay the farmer while procuring cane. On top of
this sugar producing states set their very own State Advised Price (SAP)
which many a times is much higher than FRP for reasons best known by
the State Governments themselves
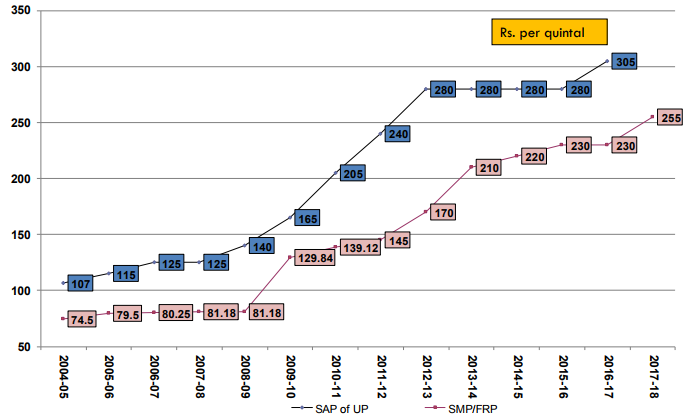
Let us have a look at how the mood of the government decides the pricing of sugarcane in the market…
The blue line shows how SAP has moved over the years while the pink line shows the gap between SAP and FRP in Uttar Pradesh
Have
a look at how the SAP more than doubled in 5 years during 2009-14. This
was the period when Mayawati governed Uttar Pradesh as the Chief
Minister while there was a Congress led government at the Centre
While the SAP decides the cost of procurement for the mills the final selling price depends upon various factors viz. export quota, domestic demand, government controlled levy.
Let us understand each of these in detail…
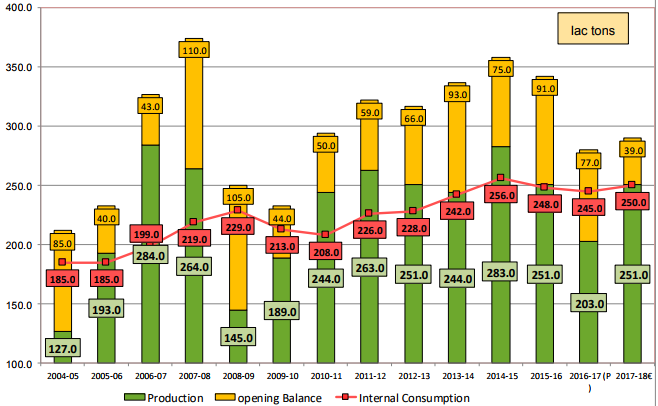
Domestic demand
This
is the demand supply situation in the domestic market. The supply
depends not just on the production but also the opening stock for that
year. The demand for sugar being a basic necessity remains constant and
keeps inching up every year. Since demand is relatively inelastic
pricing should remain more or less stable. However, the supply is very
volatile, which means it is not the demand which is the problem but what
moves supply.
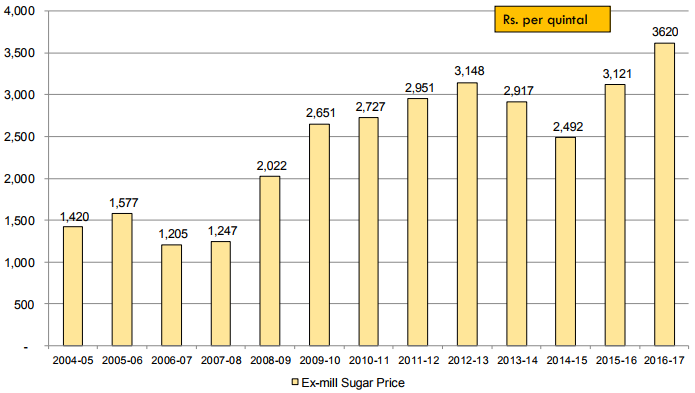
Let’s have a look at how ex mill sugar prices have moved over the last decade
As
we can see the current ex mill prices are the highest in over a decade.
As we write ex mill prices for sugar trade in the same range as of
FY17.
Government controlled levy
This
regulation that the government used to impose on sugar companies was
called the monthly release mechanism by which the Government controlled
the quantity that Mills could 'release' into the open market. In
addition to the release mechanism, sugar mills had to sell 10% of their
produce to the Central government under the levy quota at subsidized
rates.
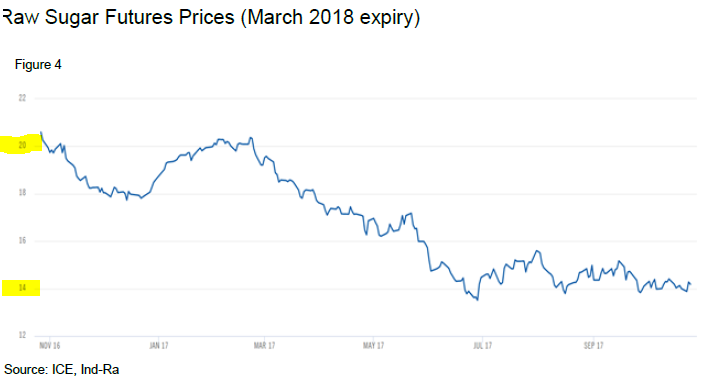
Exports/Imports
The government controls import and export of sugar in the country
The
prices of sugar have kept falling in the international markets over the
last year. However, the government incased import duty to the already
existing 40% by another 10% to stop cheap global sugar from flooding the
Indian markets. Similarly when prices increase in global market sugar
companies can only export on a pre fixed quota mechanism thus not
allowing domestic pricing to be affected by global volatility
Let’s see how all of this interference affects the sugar economics in the country
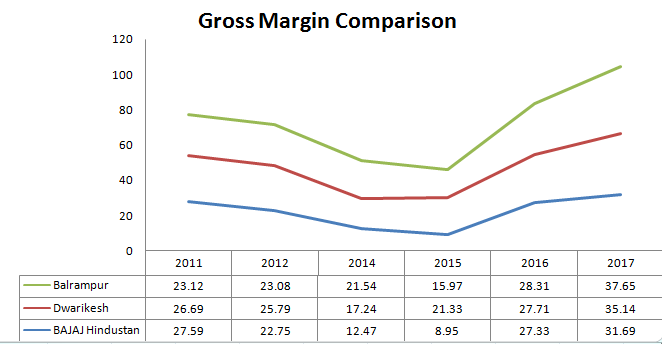
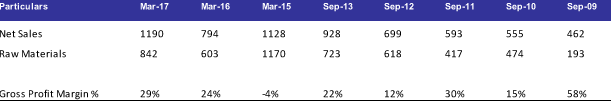
We use Dwarikesh Sugar as a case study to understand how companies operating in sugar sector were affected
Notice the difference between SAP and the cost of raw materials booked by the company
Notice the way realizations moved in relation to cost
This led to gross margins falling from a high of 58% to negative 4%
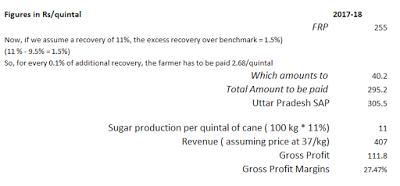
Here is a case explaining how FRP & SAP affect pricing for sugar companies in Uttar Pradesh
The
FRP set by the central government entails a base price with benchmark
recoveries of 9.5%. For every additional recovery that mills make out of
their cane, they have to pay the farmer an incentive of Rs 2.68/quintal
for every 0.1% of additional recovery.
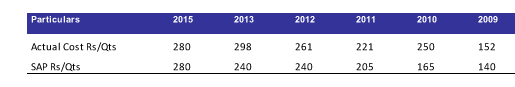
We use another case study of Ponni Sugars to show the attitude of the government while the companies were bleeding
Now let us see what the biggest sugar producer in India had to say two years ago…
This
is what the MD of Balrampur Chini Mills had to say in the Annual Report
of 2015. The industry was dying. He suggested a solution. Most of the
steps advocated were similar to what the Rangarajan Committee had recommended noted as under:
De regulation of Indian sugar sector
Linking cane procurement price with market pricing of sugar
Abolishment of monthly release mechanism and levy sugar quota
Revenue sharing with farmers from processing of other by products of sugarcane
Stable external trade policy with moderate tariff levels
So what has the Government done…?
The state governments of Karnataka and Maharashtra have approved the implementation of the Rangarajan committee recommendations
The central ministry has written to the Uttar Pradesh government to implement Rangarajan committee recommendations (central and state governments in Uttar Pradesh are similar)
The situation today
India
is expected to produce around 25.5mt of sugar this year, primarily led
by significantly higher output from Maharashtra and Karnataka. With
domestic demand being stable around that 25mt mark, there shouldn't be a
need for imports into the market. With demand and supply being in
equilibrium and the central government pushing the implementation of the
cane pricing formula of the Rangarajan committee in U.P, prices could
be stable moving ahead. Stability in prices will lend themselves to a
stream of free cash for companies as growth capex isn’t on the anvil
yet.
De-leveraging
balance sheets and subsequent conversion of debt into equity has been
one of the prominent highlights of corporate India in recent times and
the sugar sector is no exception to that. In the past couple of years,
most sugar companies have diverted all of their cash flows towards debt
repayment and have healthier balance sheets
The
following is an extract from Ind-Ratings highlighting the opening stock
for FY2018 which should keep the prices stable as the opening stock is
lower than the typical buffer kept by companies
Important understandings
Financial condition of sugar mills on a much better footing than 2-3 years ago
Most of the cash flows generated over last two years have been utilized in debt repayments
No growth capex done. However, once situation improves many mills now closed can soon start operations
Government has implemented structural changes in the sector and states are now more pro active towards plight of mills
This
is a part of the series in which we have tried to understand sugar
sector. In the next part we will have a look at individual companies
across different regions to understand how companies have evolved over
the last two decades in different regions